APM for .Net Core on Linux - Beyond Log Analyzing

For the folks out there, not familiar with the abbreviation APM, in the context of this post stands for Application Performance Monitoring.
APM 0.1 - Leverage existing tools (and logs)
For the last 2 years, I'm part of a team building an exciting new B2B application using the latest and greatest ASP.Net Core (yes, B2B applications can be also exciting, and by the way, we are hiring). Everything was great, until few months into our utopia. Suddenly, out of the blue, we got our first customer. Maybe you know how demanding customers are. Additionally to all the new features, they also expect a reasonably performant and always available service.
We used a log management tool, sumologic, to collect logs from our different micro services (yes, we have micro services, I said it was the latest and greatest) into a central place. This tool allowed us to quickly create dashboards on top of our logs, to get some initial insights into the application. This is sort of what we ended up with:
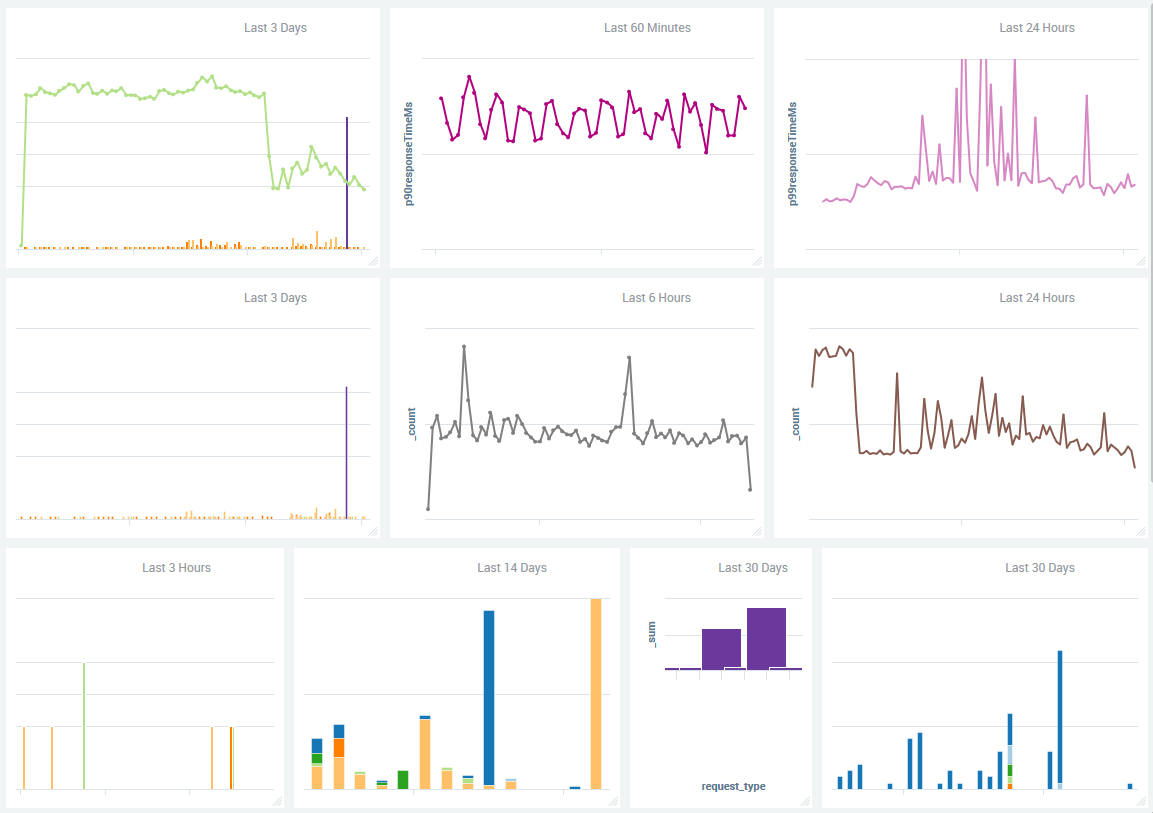
Limitations
It was great for the beginning. We could detect trends, notice sudden spikes after deployment and integration sending bad requests. But once we saw that we do have a performance issue, that's where the dashboard stopped. It was up to us to read the code and figure out (guess) which part might be slow.
If you noticed a spike right after deployment, it was fairly straight forward. We try to deploy into production multiple times per week, so the number of features deployed every time is fairly small. This way you can check (by checking the logs) which calls are actually slow, and commit could have caused it. But if inefficiency slowly creeps into the application, and suddenly a slightly larger customer, than you are used to, goes live, you might end up with terrible performance, or even an unstable application, and no idea how you got there.
APM 1.0 - The wish list
This is when we realized, we need to have way more insights into the system. We needed a tool, which ...
- ... is cheap (free would be better, but let's be at least slightly realistic here)
- ... is easy to install
- ... is easy to configure (actually no configuration necessary)
- ... works with our technology stack (ASP.Net Core on Linux)
Some colleagues were super enthusiastic about New Relic. I've heard stories, how it's only needed to add a gem to your application (you might have guessed, this is about some old Ruby on Rails project) and suddenly you know exactly what is going on. Actually the screenshot on their website looks much better than our dashboard.
APM 0.1-alpha - Disenchantment
Turns out it wasn't all just rainbows and unicorns. It felt more like mud and dirt and in a special case even deception.
New Relic kinda worked, but it wasn't at all what we had hoped for. After talking to another colleague, I realized that probably having everything magically out of the box won't work for us and we'll need to either configure New Relic appropriately, or wrap somehow the calls we want to track manually. This was already way more effort than we were originally ready to put into an APM integration. And while they did have a small amount of out-of-the-box instrumentation for specific libraries, they didn't support the latest versions we were using, with no guarantees to support them any time soon, and were lacking a lot of features on Linux.
So of we went looking for something better, and found retrace, which sounded great. They mention .Net Core, docker, Linux and AWS on their main page. After wasting ~6 hours trying to integrate it, I went back to google. It took me at least half an hour to find a support ticket, which simply said, that they do not yet support .Net Core on Linux. I believe they have all those technologies they mention on the main page integrated, just not together. And the fact that it wasn't (at that time) mentioned in any documentation just made me really angry.
APM 0.4 - A new hope
We've found a (for us new) project, OpenTracing.
Vendor-neutral APIs and instrumentation for distributed tracing
It sounded great. Additionally, since .Net Core, ASP.Net Core and EF Core mentioned it in their repositories and there is even an instrumentation library for .Net Core, we gave it a try. In worst case we'd use some self-hosted service to analyze those traces. I talked to a friend of mine about it, who works at datadog and turned out, he was working on a (fairly) new APM feature, which also supports open tracing. So he quickly helped me configuring it and the result was amazing. Out of the box, we saw the Controllers with Actions and database calls including SQL queries created by EF Core.
So this was an amazing first start and very quick win, but depending on the calls, we might have a lot of layers of business logic between the action and the database call. That means that having the SQL Queries logged one by one doesn't really help to figure out, which part of the application is slow. Therefore, we've created a simple interceptor, which is attached wherever possible using the Autofac IoC container. That interceptor really boils down to this one function:
protected override async Task<TResult> InterceptAsync<TResult>(IInvocation invocation, Func<IInvocation, Task<TResult>> proceed)
{
    using (IScope scope = _tracer.BuildSpan(GetSpanName(invocation)).StartActive(finishSpanOnDispose: true))
    {
    	SetTags(invocation, scope);
    	return await proceed(invocation);
    }
}
Getting the first integration ready took us just one day (so ~8-10h). It's still not all rainbows and unicorns. Without the help of my friend, I'm not sure how long we'd have spent to set it up correctly and if we'd had manaaged at all. But in their defense, it's a new product under active development and improving every day. They just released support for .Net Core on Linux for their library, and we might switch in the future, but thanks to their support for OpenTracing, it isn't a must.
I'm working on another post (maybe it will be a set of posts), containing details how to integrate and use datadog. Additionally I'll be talking about how we use the tool to analyze, understand and improve our application. The posts will be linked here when ready.